What’s New in GRITS 1.7!
Check out the new updates in GRITS 1.7, including custom emission scenarios, custom resource price forecasting, the ability to manage multiple campuses and locations, geolocation of facilities and campuses, viewing projects in your peer networks, a new chat feature, and cover photos for your projects. To learn more about GRITS and stay updated on exciting new developments, visit the GRITS website!
Log in to GRITS now to see these new features in action!
Custom Emissions (CE) Scenarios
You can now create custom emissions factors for electricity, steam, and chilled water (the three resources that are generated from potentially different mixes of fossil fuels or renewables). Scenarios are created or deleted on the Settings page, under the “emissions factors” tab. You can also view default emissions factors for the three resources here. For institutions with multiple campuses in different locations, you’ll have a different default electricity emissions factor for each location. Steam and chilled water defaults are the same for all locations.
CE scenarios can be applied via a campus or on individual projects. A CE scenario can be set on a campus by clicking to “edit” the campus. This scenario will apply to all projects linked to that campus and is automatically enabled.
A CE scenario can be set on an individual project under the “custom settings” tab on the Project Detail page. To apply it, click to enable emissions settings under the “custom settings” tab and then flip the switch on the “details” tab to “enable custom settings.” Choosing “GRITS default” is also possible on the “custom settings” tab, and will allow projects that are currently affected by a campus-based CE scenario to revert to default emissions factors. Scenarios can be set for all three resources simultaneously.
Custom Resource Price Forecasting
You can now create custom resource price forecasts that show how your resource price and financial savings would change under a given rate of change or set price over various years. A scenario can be created for all resources. Scenarios are created or deleted on the Settings page under the “resource price forecasting” tab.
They are applied in the same way as CE scenarios.
This is how a resource price forecast looks for institutions without a revolving fund:
This is how a resource price forecast looks for institutions using GRITS in revolving fund mode:

Campuses
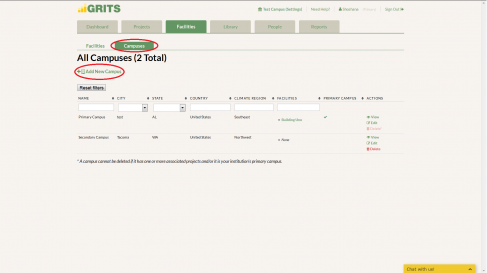
Do you operate on more than one campus? You can now group your facilities into different campuses and apply custom emissions and resource price scenarios to all projects associated with each campus. This feature is especially useful if you work across a school-wide system or operate in multiple locations.
Create and edit campuses in the Facilities tab. All projects must be linked to a campus. One campus has been created for your institution and each of your projects are attached to it.
Geolocation of facilities and campuses
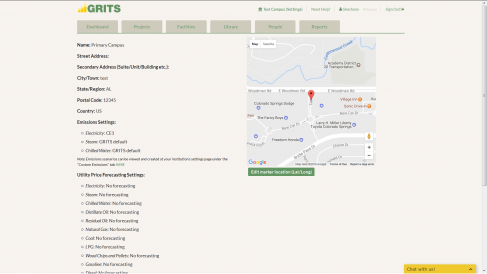
Both facilities and campuses are geolocated via Google Maps based on their city, street address, or postal code. If no information is entered for a facility, the location of the campus is used to geolocate it. The map appears under the Facilities tab when viewing or editing a facility or campus. You can manually move the pin that specifies the facility or campus’s location or edit the latitude and longitude coordinates below the map for even greater precision.
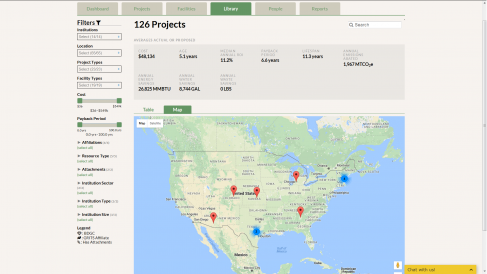
The Projects tab and Project Library now have the option to turn the table into a map. On the Projects tab, the map displays the location of each project based on the facility it’s linked to. Projects without facilities will not appear on the map. Clicking on the pin displays the name of the facility with the number of projects of each type, such as proposed, in-progress, and completed.
In the Project Library, the map shows the location of each campus. Since all projects are linked to a campus, all projects in the Library appear on the map. Clicking on the pin displays the institution’s name and campus address, along with the number of projects there. Anonymous institutions cannot see the map and their projects do not show up on the map for non-anonymous institutions.
View Projects within your Peer Network
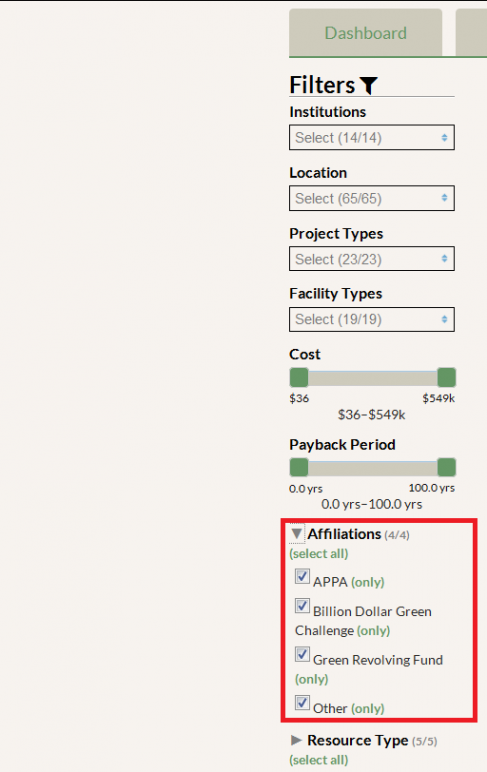
Does your institution belong to a peer network like APPA or the Climate Leadership Network? If so, you can now filter by this affiliation in the Project Library to see exactly what your peer institutions have been up to. Just click to only view projects within your network under the “Affiliations” filter in the Library.
Chat with us online!
Introducing the GRITS chat! When you’re logged into GRITS, you can start a conversation with GRITS staff by clicking the “Contact us!” button on the bottom right-hand corner of the screen. During business hours (EST), we’re available live. At other times, we’ll get back to you within the next business day.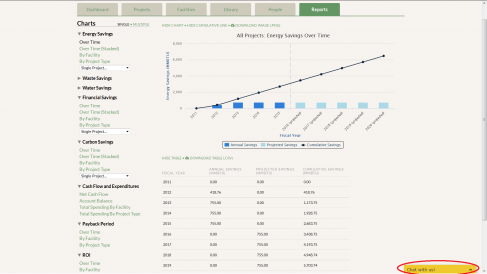
Cover photos
You can now add a cover photo to your projects and display the area you’ve been working on. Upload a photo to the “attachments” section of the Project Details page or use an existing photo that you have already uploaded, and click to display it as a cover photo on the front page of your project. Clicking on the photo zooms into a larger version. If the attachment is marked “private” and then made into a cover photo, only users at your institution can view it.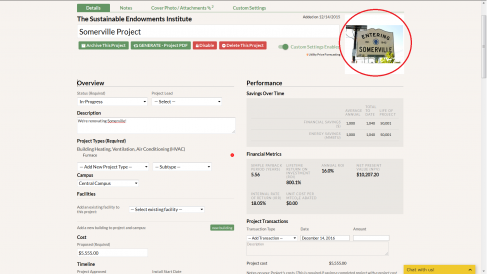
Let us know if you have any questions about the new features or if you have ideas for future features you would like to see in GRITS! Contact us at GRITS@EndowmentInstitute.org.
-
Subscribe
Subscribe via RSS -
Archives
- August 2023
- December 2019
- October 2019
- December 2018
- August 2018
- December 2017
- December 2016
- October 2016
- August 2016
- May 2016
- November 2015
- October 2015
- September 2015
- May 2015
- April 2015
- February 2015
- October 2014
- August 2014
- April 2014
- March 2014
- December 2013
- November 2013
- September 2013
- August 2013
- April 2013
- March 2013
- January 2013
- October 2012
- July 2012
- May 2012
- January 2012
- October 2011


