Introducing GRITS 1.5!
Check out the new updates in GRITS 1.5:
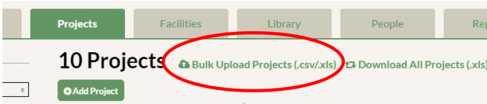
1. Data entry, made easier: Upload a spreadsheet (.csv/.xls) to GRITS with your project data and it will automatically insert that project data into your GRITS account within three days or sooner. A GRITS staff member will contact you when it is ready. The uploaded spreadsheet should include the following information for each project: project name, status, approval or completion date, project cost, lifespan, description, project type, resource saved, cost per unit of resource (e.g. electricity), and annual resource savings. We recommend you use our spreadsheet template, which can be found once you click on the “Bulk Upload Projects” feature on the Projects tab.
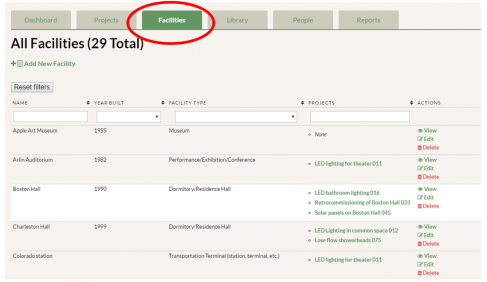
2. The ability to organize all of your buildings and facilities: The new Facilities tab allows you to see a list of projects within each building. You can also edit your buildings and add new buildings on your campus here.
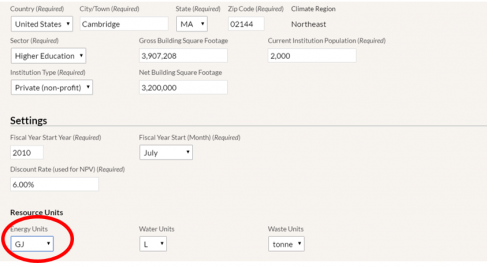
3. Energy, water, and waste units the way you want them: Now you can customize your default units to view aggregate energy, water, and waste savings data on every page in GRITS by setting your Resource Units on the Settings page (previously called the Institution Profile).
You can view aggregate energy savings in million British Thermal Units (MMBtu) or gigajoules (GJ), water savings in gallons (gal), liters (L), cubic meters (m3), or hundred cubic feet (Ccf), and waste savings in pounds (lbs) , kilograms (kg), short tons (ton), or metric tons (tonne).
Changing units will affect how you see your savings on every page, including the Dashboard, the Reports page, and even how you view savings from projects at other institutions in the GRITS Library.
4. Project-specific data can be viewed in the units that are on your utility bill: With the new Custom Settings sub-tab in the Project Detail page, if you enter a project with electricity savings in kilowatt-hours, you’ll be able to view all of your savings on that project’s page in kWh. Or if you enter natural gas in therms, view your project’s savings in therms! Track units that are meaningful to you and your projects.
Previously, if you entered a project with specific units (like kWh), the units were always converted into MMBtu in the Annual Tracking Data table on that page. This is still the default on the Project Detail page (see image below). However, you can now go to Custom Settings to view your project in any units that you’d like!
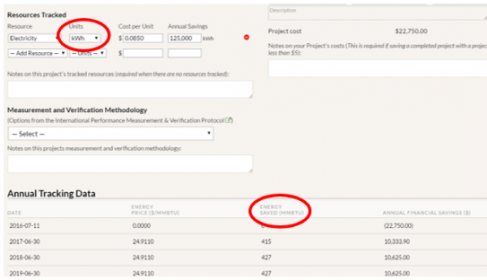
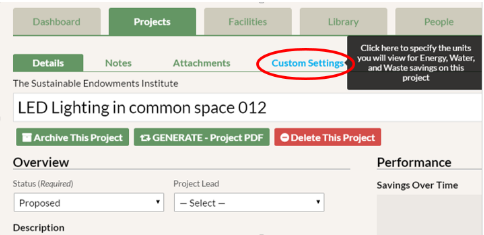
In Custom Settings you can choose the Energy (or Water and Waste) units that you want to view on this page. For example, you can see this lighting upgrade project in kWh savings.

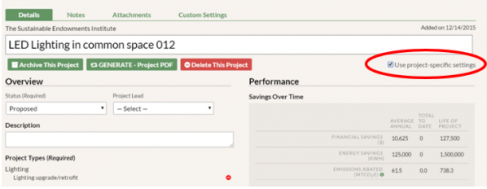
Back on the Project Detail page, make sure to check the box “Use project-specific settings” and you will see the savings in kWh or whichever unit you chose.
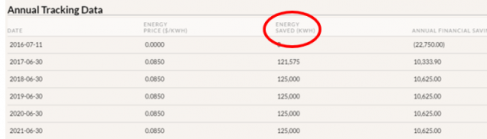
Since you chose kWh, these are the units that appear in the Annual Tracking Data table now.
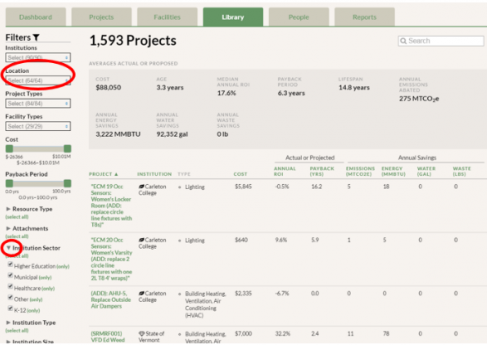
5. Collapsible filters: Choose the filters you want to see expanded in the GRITS Library and in your Projects tab by clicking the grey triangle near the desired filter name. (Click the triangle again if you want to collapse the filter.) The Climate Region filter is new, improved, and renamed as the Location filter where you can now also filter by individual U.S. states and Canadian provinces.
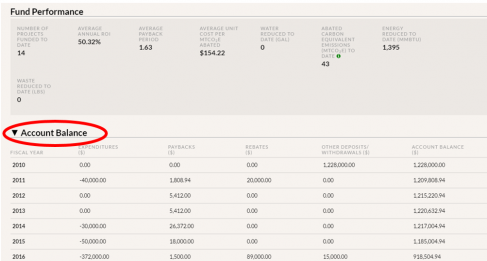
6. The financial transactions table also moved! Previously the table was located on the Institution Profile (Settings) page and has been moved to your GRITS Dashboard. This table is called “Account Balance” if you have a GRF and “Annual Expenditures and Savings” if you do not have the GRF version. You can also collapse this table by clicking on the triangle on the left.
Let us know if you have any questions on the new features or if you have ideas for future features you would like to see in GRITS! Email us at GRITS@EndowmentInstitute.org.
-
Subscribe
Subscribe via RSS -
Archives
- August 2023
- December 2019
- October 2019
- December 2018
- August 2018
- December 2017
- December 2016
- October 2016
- August 2016
- May 2016
- November 2015
- October 2015
- September 2015
- May 2015
- April 2015
- February 2015
- October 2014
- August 2014
- April 2014
- March 2014
- December 2013
- November 2013
- September 2013
- August 2013
- April 2013
- March 2013
- January 2013
- October 2012
- July 2012
- May 2012
- January 2012
- October 2011